⚠️ Unable to Load Embedded Report
An error occurred while generating the token or embedding the report.
Admin Panel
AdminManage your organisation, users, and settings
Team Members (0 members)
People appear here automatically the first time they sign in with Microsoft. Set their role and give them access to reports and dashboards.
| Name | Role | Report access | Actions |
|---|
🛡️ Role Governance & Access Control Policies
Define system privileges, operational boundaries, and security levels across the organization.
👑 Admin
FULL CONTROLHighest privilege level. Full governance of users, reports, role elevation, and Microsoft Entra ID diagnostics.
- Change and elevate user roles
- Create and delete user accounts
- Add, move, and delete Power BI reports
- Assign and revoke report access
- Execute Azure AD connection tests
👔 Manager
OPERATIONALOperational dispatcher. Empowered to sync reports from Power BI and assign report permissions to team members.
- Sync reports from Power BI
- Assign / revoke reports for users
- Cannot change user roles
- Cannot delete user accounts
👤 User
VIEW ONLYStandard analytics viewer. Access is strictly scoped to assigned reports with Row-Level Security.
- View authorized reports & pages
- Interactive cross-filtering & slicing
- Access Data Dictionary & Usage Guide
- No access to Admin settings
Role Capabilities Comparison Matrix
| Platform Capability / Action | Admin | Manager | User |
|---|---|---|---|
| View Assigned Power BI Reports | ✓ | ✓ | ✓ |
| Sync Reports from Power BI | ✓ | ✓ | ✗ |
| Update Data Dictionary & Metric Catalog | ✓ | ✓ | ✗ |
| Assign & Revoke Reports for Users | ✓ | ✓ | ✗ |
| Change User Roles (Admin / Manager / User) | ✓ | ✗ | ✗ |
| Create & Delete User Accounts | ✓ | ✗ | ✗ |
| Delete Configured Reports | ✓ | ✗ | ✗ |
| Microsoft Entra ID (Azure AD) Connection Tests | ✓ | ✗ | ✗ |
Role Assignment & Governance
Administrators can update member roles in real-time below.
| Member | Current Role | Role Designation |
|---|
Power BI Reports
Every report in the Power BI workspaces DG-Analytics can access is added here automatically, grouped by workspace and Fabric folder. Give people access on the Users page.
| Report | Folder | Access |
|---|
Microsoft Entra ID (Azure AD) Connection Diagnostics
Validates authentication of the configured Service Principal (`TENANT_ID`, `CLIENT_ID`, `CLIENT_SECRET`) to ensure Power BI tokens can be generated.
📈 Usage & Activity
Who is using the portal, which reports and dashboards they open, and how long they spend. Time counts only while the portal is on screen and the person has been active in the last 10 minutes. Records are kept for 6 months.
📖 Data Dictionary
Every measure, table and function in the Power BI models, read from the models themselves.
| Metric / Measure Name | Category | Formula / Logic | Data Source | Actions |
|---|
🧭 How to use DG-Analytics
A short guide to finding reports, keeping favourites and understanding the numbers.
1. Signing in
- Click Sign in with Microsoft and use your DG work account. There is no separate password.
- The first time you sign in, your account is set up automatically with the Company Leaderboard. Reports are added by a portal admin (see More access & help below).
- To sign out, click Sign out under your name at the bottom of the sidebar. The small number below it (e.g. v2.0.1) is the portal version.
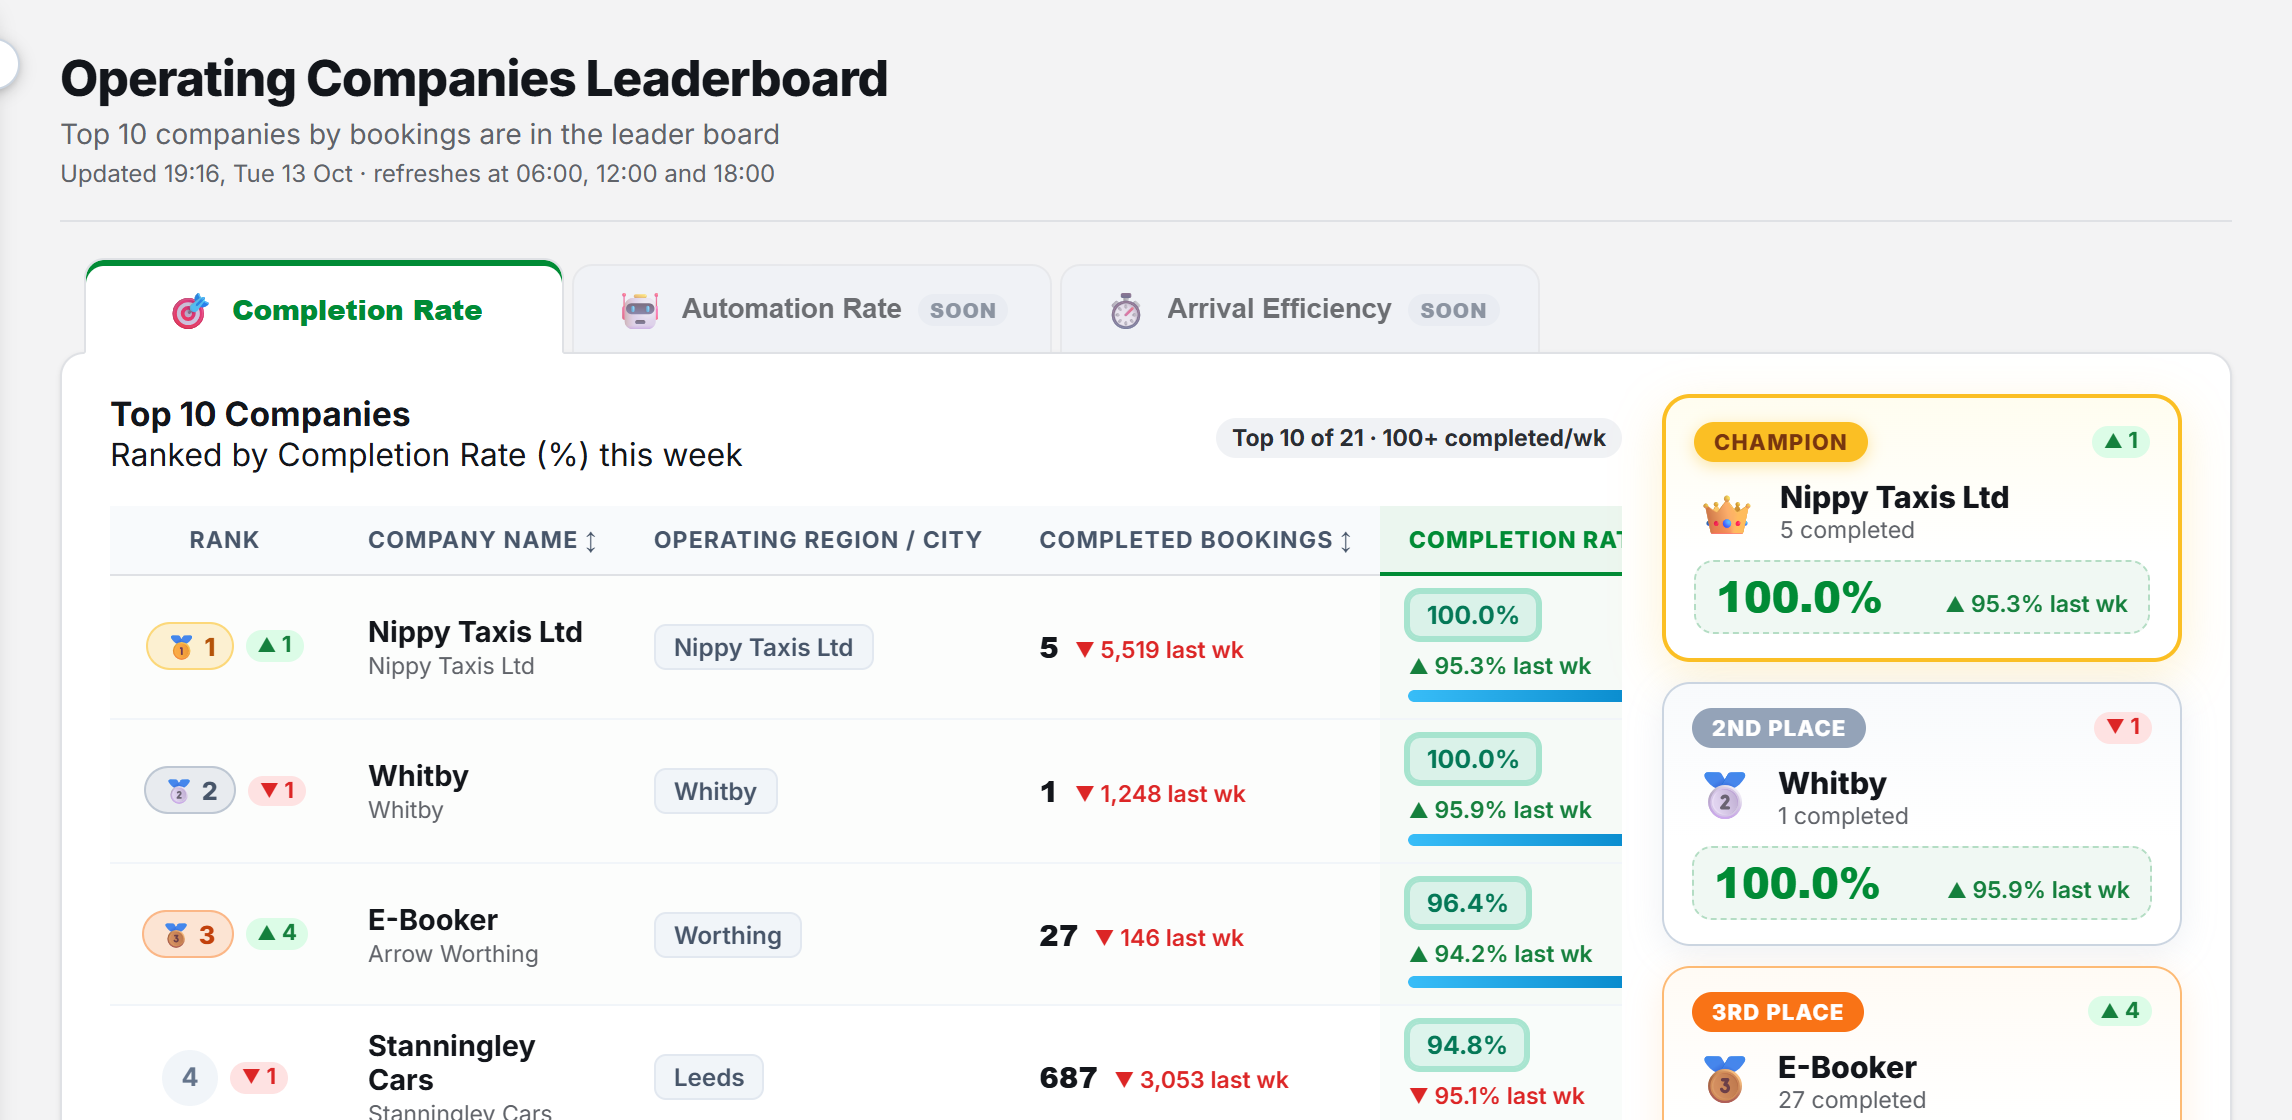
2. Company Leaderboard
- It opens when you sign in. You can always get back to it under Dashboards at the top of the sidebar.
- Companies are ranked on last week (the last full Monday–Sunday week). Only companies with 100+ completed bookings last week are included.
- Under each figure, ▲ / ▼ shows where the company is heading this week: its full days so far compared with the same days last week. Next to the rank, ▲ 2 or ▼ 1 shows where it would place if the week carries on that way. Hover over any of them for the exact figures.
- Use the tabs above the table to change what companies are ranked by. Tabs marked Soon are not available yet.
- The figures are refreshed at 06:00, 12:00 and 18:00 UK time. The time of the last update is shown under the title.
3. Finding reports
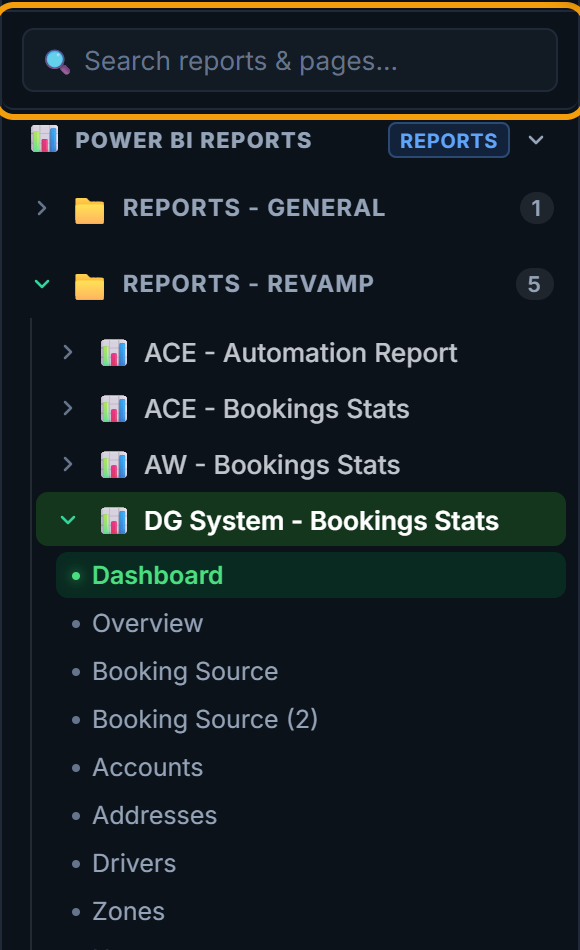
- The sidebar lists, from the top: Dashboards, My Favourites, then your Power BI reports grouped by workspace, and inside each workspace by the same folders as in Fabric.
- Click a workspace or folder to open it, click a report to load it, and click a page name under the report to jump to that page.
- Type in Search reports & pages at the top of the sidebar to find a report or page by name.
- Use the round button on the edge of the sidebar to shrink it and give the report more room.
- You only see the reports you have been given access to.
4. Working in a report
- Click a bar, slice or row in a chart to filter the rest of the page by it. Click it again to clear.
- Change pages from the sidebar or from the page tabs inside the report.
- The button in the bottom-right corner shows the report full screen, which is handy for meetings. Click it again (or press Esc) to return.
5. Favourites
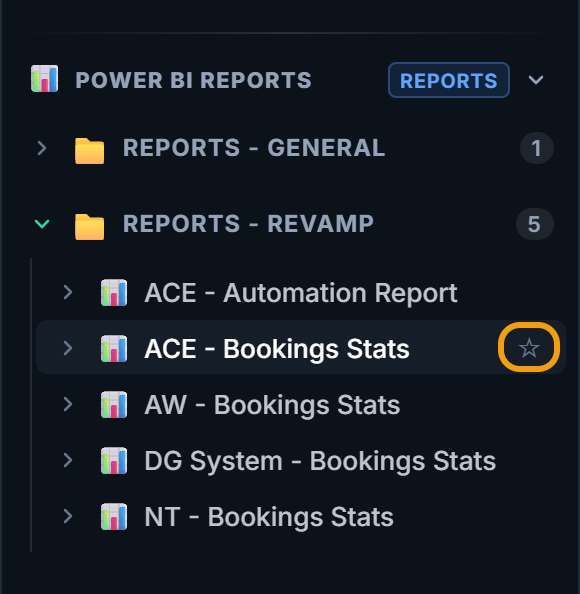
- Hover over a report in the sidebar and click the ☆ star next to its name.
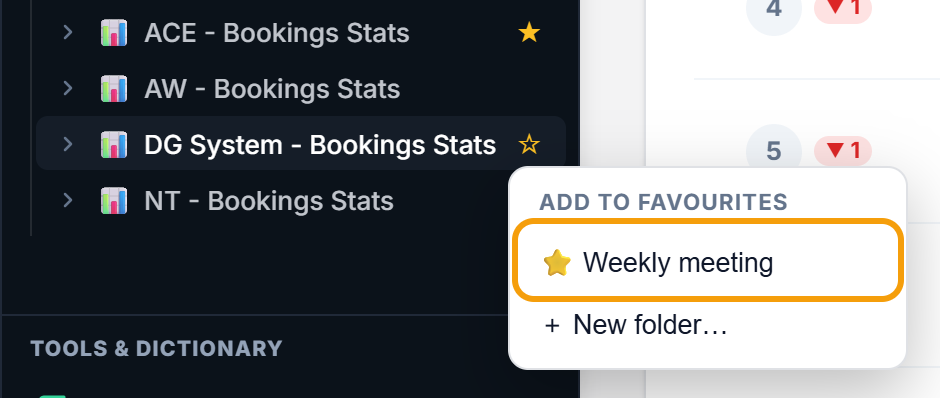
- Pick a folder, or choose + New folder… and give it a name, such as “Weekly meeting”.
- The report now appears under My Favourites in that folder, and its star turns to ★.
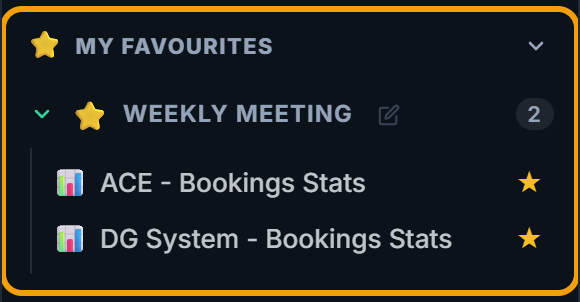
- To move a favourite to another folder, or remove it, click its ★ and choose the folder or Remove from favourites.
- To rename a folder, hover over it and click the pencil.
- Favourites are personal: only you see them.
6. Data Dictionary: what does this number mean?
Open it from Tools & Dictionary → Data Dictionary at the bottom of the sidebar. It has four tabs:
- Glossary: plain-English definitions of the main figures, such as Completed Bookings, Completion Rate or WoW %, including which fleets each one covers. Use the category buttons or the search box to narrow it down. Start here.
- Measures: every measure in the Power BI models, with the model and table it lives in, its DAX formula, its Context (e.g. WeeklyContext) and its Category. Search by name or formula, or filter by model, context and category. Click a formula to see all of it.
- Tables: the tables in each model. Click a table name on the Measures tab to see that table, or click a table's measure count to see its measures.
- Functions: reusable DAX functions defined in the models.
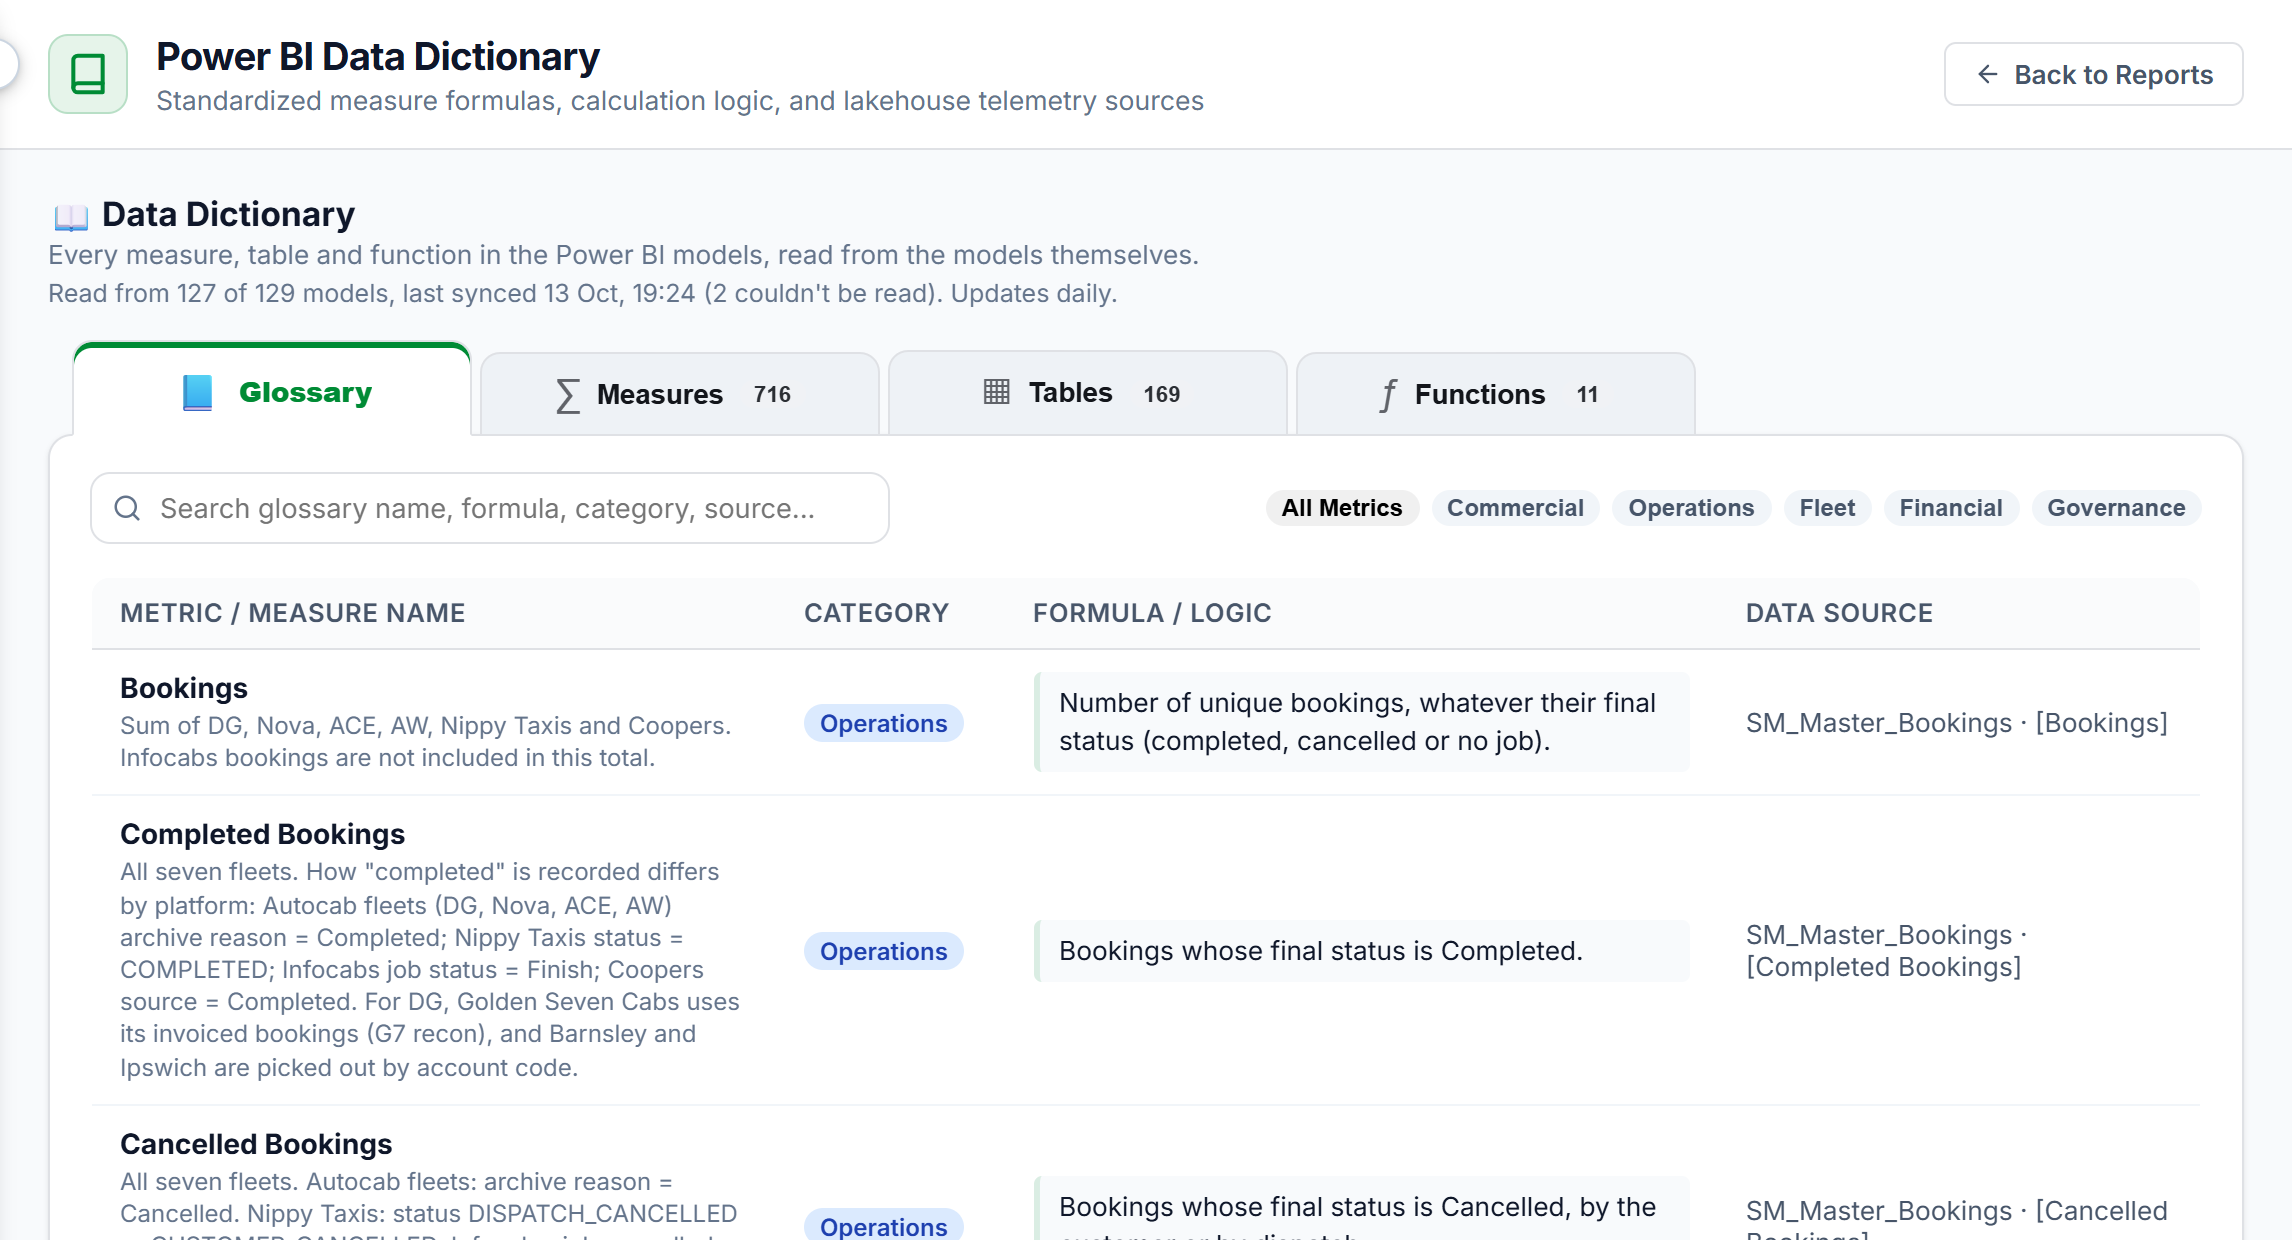
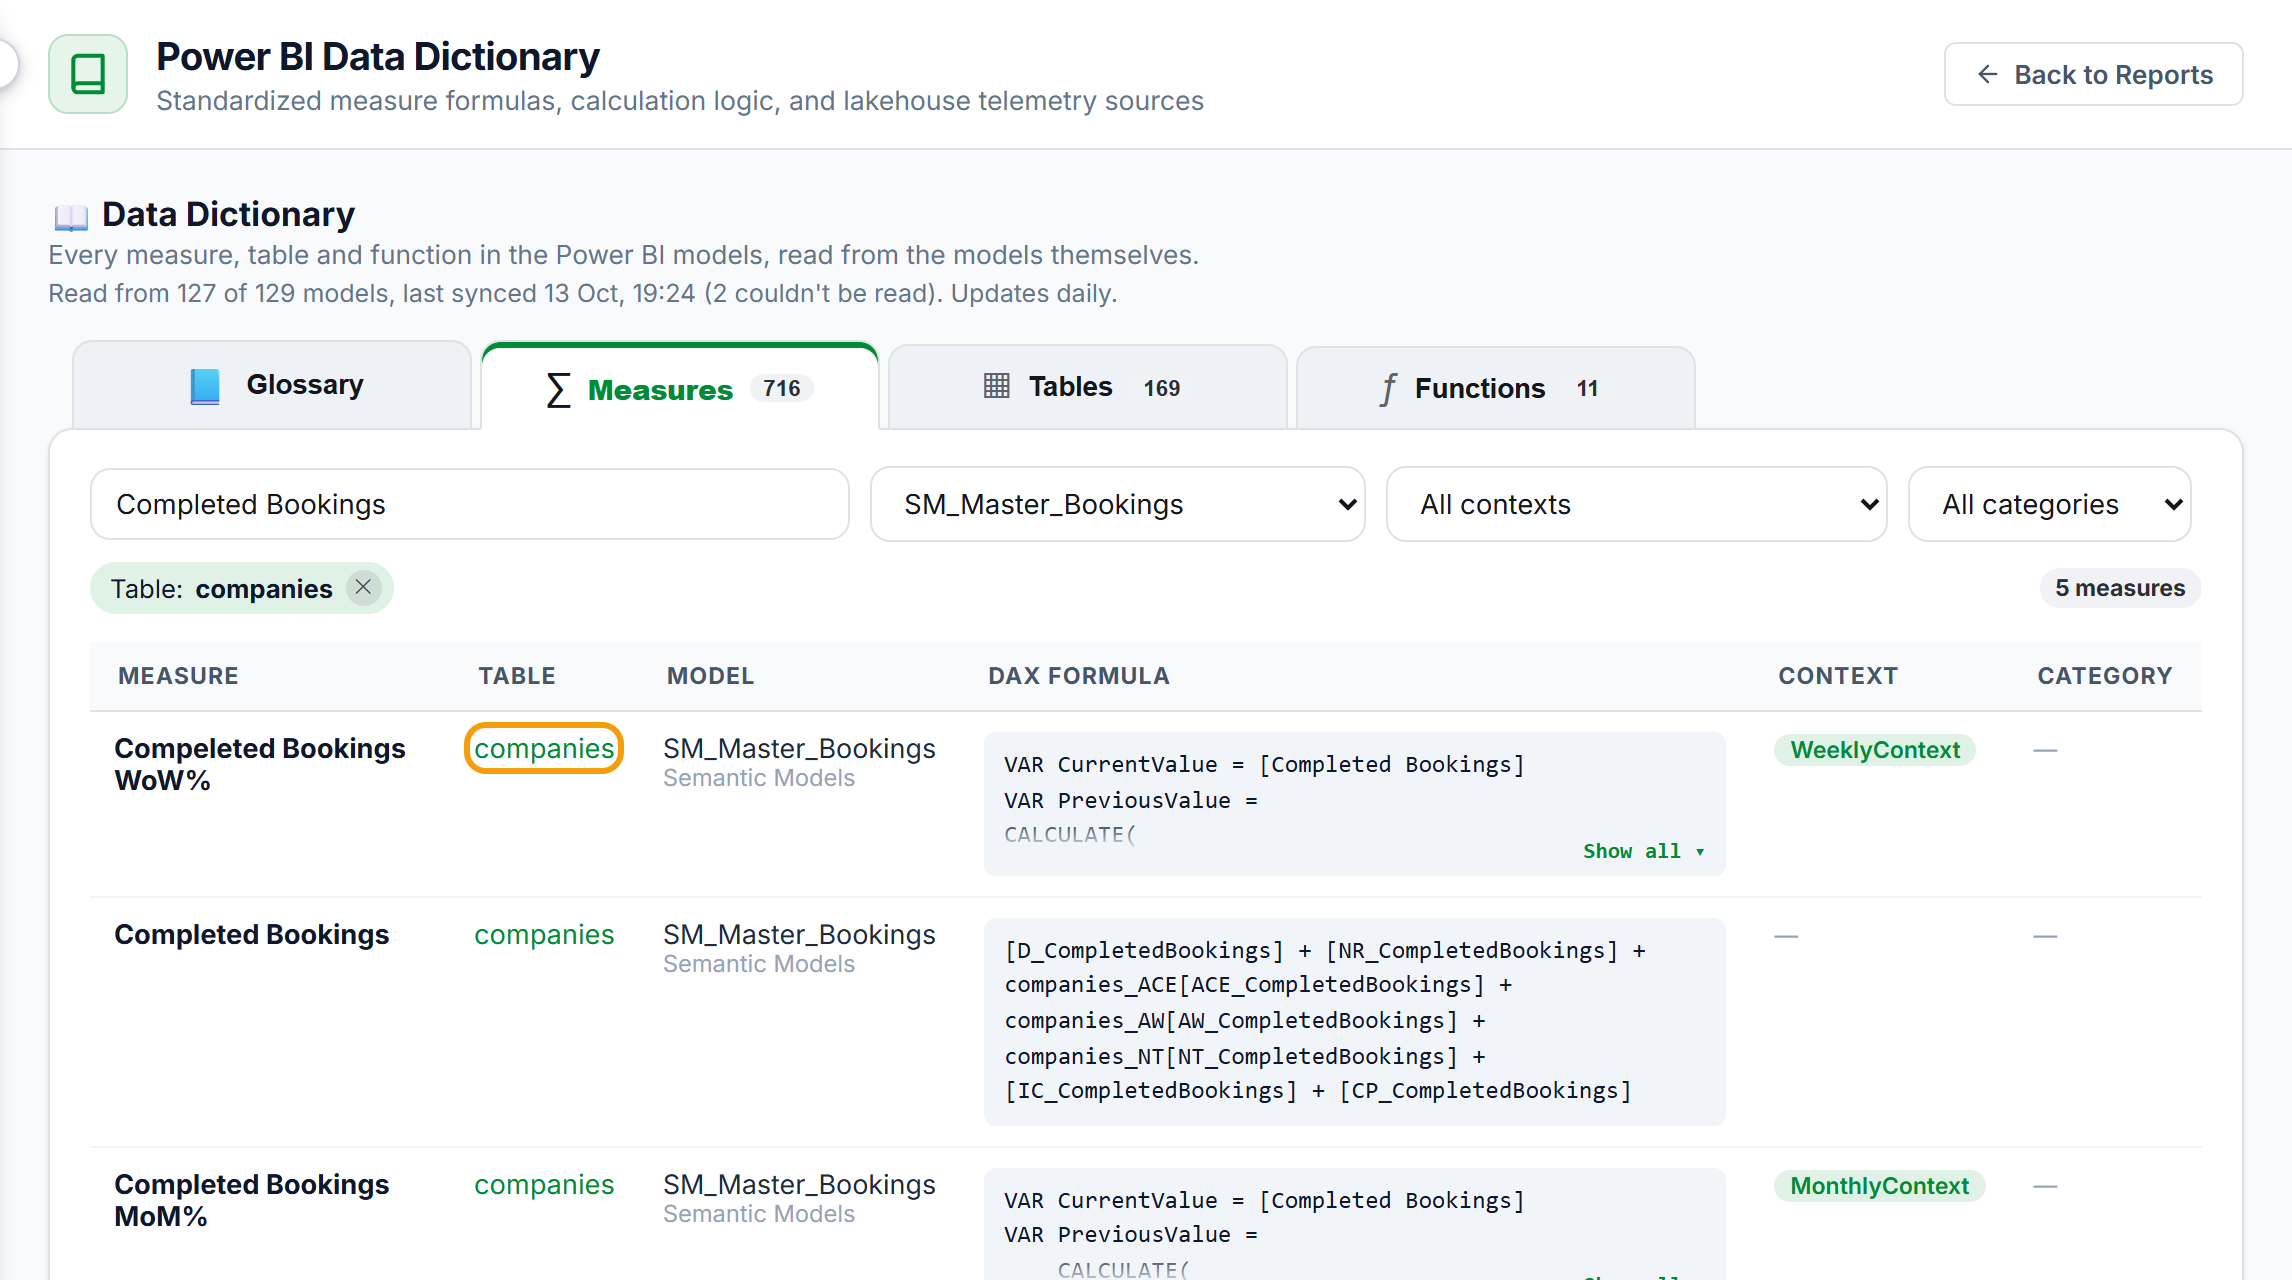
💡 Not sure what a figure in a report means? Search its name in the Glossary first. If it's not there, search it on the Measures tab to see exactly how it's calculated.
7. DAX Explorer (if you have access)
- Under Dashboards, for people who write their own queries.
- Pick a Model, click measures or functions on the left to add them to the query, then click Run Query (or press Ctrl+Enter).
- Use Copy to paste the results into Excel, or Download CSV to save them.
8. More access & help
- Need a report or dashboard you can't see? Ask a portal admin to add it to your account. It appears in your sidebar next time you open the portal.
- For anything else, open Tools & Dictionary → Get Help.
💬 Help & Technical Support
Support channels and analytics governance contact information.
Need Assistance or New Report Access?
For access requests, row-level security role modifications, or dataset refresh inquiries, please reach out to the Business Intelligence & Analytics team.